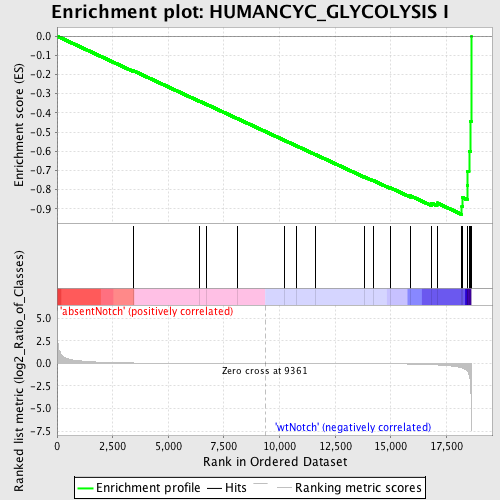
Profile of the Running ES Score & Positions of GeneSet Members on the Rank Ordered List
| Dataset | Set_03_absentNotch_versus_wtNotch.phenotype_absentNotch_versus_wtNotch.cls #absentNotch_versus_wtNotch.phenotype_absentNotch_versus_wtNotch.cls #absentNotch_versus_wtNotch_repos |
| Phenotype | phenotype_absentNotch_versus_wtNotch.cls#absentNotch_versus_wtNotch_repos |
| Upregulated in class | wtNotch |
| GeneSet | HUMANCYC_GLYCOLYSIS I |
| Enrichment Score (ES) | -0.9295882 |
| Normalized Enrichment Score (NES) | -1.7503777 |
| Nominal p-value | 0.0 |
| FDR q-value | 0.020143377 |
| FWER p-Value | 0.106 |
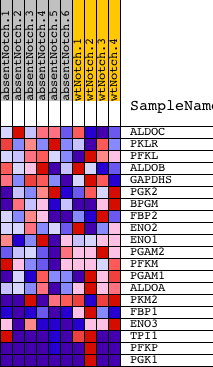
| PROBE | DESCRIPTION (from dataset) | GENE SYMBOL | GENE_TITLE | RANK IN GENE LIST | RANK METRIC SCORE | RUNNING ES | CORE ENRICHMENT | |
|---|---|---|---|---|---|---|---|---|
| 1 | ALDOC | 450121 610427 | 3427 | 0.044 | -0.1803 | No | ||
| 2 | PKLR | 1170400 2470114 | 6390 | 0.009 | -0.3388 | No | ||
| 3 | PFKL | 6200167 | 6723 | 0.008 | -0.3559 | No | ||
| 4 | ALDOB | 4730324 | 8087 | 0.003 | -0.4289 | No | ||
| 5 | GAPDHS | 2690463 | 10198 | -0.002 | -0.5422 | No | ||
| 6 | PGK2 | 2650091 | 10781 | -0.004 | -0.5731 | No | ||
| 7 | BPGM | 5080520 | 11595 | -0.007 | -0.6163 | No | ||
| 8 | FBP2 | 1580193 | 13817 | -0.020 | -0.7339 | No | ||
| 9 | ENO2 | 2320068 | 14205 | -0.025 | -0.7525 | No | ||
| 10 | ENO1 | 5340128 | 14984 | -0.040 | -0.7908 | No | ||
| 11 | PGAM2 | 3610605 | 15878 | -0.073 | -0.8323 | No | ||
| 12 | PFKM | 1990156 5720168 | 16826 | -0.138 | -0.8708 | No | ||
| 13 | PGAM1 | 2570133 | 17077 | -0.165 | -0.8695 | No | ||
| 14 | ALDOA | 6290672 | 18195 | -0.486 | -0.8862 | Yes | ||
| 15 | PKM2 | 6520403 70500 | 18229 | -0.514 | -0.8421 | Yes | ||
| 16 | FBP1 | 1470762 | 18434 | -0.818 | -0.7800 | Yes | ||
| 17 | ENO3 | 5270136 | 18453 | -0.871 | -0.7032 | Yes | ||
| 18 | TPI1 | 1500215 2100154 | 18514 | -1.197 | -0.5995 | Yes | ||
| 19 | PFKP | 70138 6760040 1170278 | 18572 | -1.792 | -0.4426 | Yes | ||
| 20 | PGK1 | 1570494 630300 | 18612 | -4.983 | 0.0002 | Yes |